Adobe Launch Page View Count Condition to Fire Tag

session_page_view_count_adobe_launch_rule_condition

You are given a 3rd party pixel tag from Facebook or Google and asked to fire the tags when the visitor has viewed 3 pages. Or you have an email capture overlay and you don’t want to distract your visitor when they land on your site on the first page view. Adobe Launch has built in functionality to track the session page view count and let’s you fire a tag when the visitor has 3 page views (or how every many page views you want).

Continue Reading

Digital Analytics Data Quality- Your First Lesson

data-quality-digital-analytics

Make sure you are very confident in the accuracy of your data before you present it to stakeholders.

Eager Young Digital Analyst Meet the Data Quality Mousetrap

Almost 9 years ago when I was first starting out in my career in digital analytics I was tasked with an analysis of an internal search tool. It was one of those sites that had a bunch of filtering options for search. The visitor could select sizes, colors, product categories, and many other product attributes. I dove head first into the web analytics tool and started to explore the data. I quickly found what I thought was a smoking gun. According to the data, the insight I discovered was that the only internal search filtering option that visitors used was the color filter.

I presented two recommendations in my PowerPoint analysis:
1) Simplify the filtering and just keep the color filter
OR
2) Highlight the other filtering options like size, product category etc. to get visitors to use other filters

Read the story of how I found my career as a digital analyst on Craigslist.

Digital Analyst Meet the Debugger

Continue Reading

Real-Time Reporting Adobe Analytics API Tutorial

adobe_analytics_real-time_dashboard_sample_

Adobe has a nice real-time dashboard built directly into Reports & Analytics (SiteCatalyst). It is easy to configure and get up and running quickly. According to Adobe product manager Ben GainesReal-Time reports in Adobe Analytics has become one of the most popular features in Reports & Analytics.” What you may not know is that real-time data can be accessed via Adobe’s reporting API. Adobe has a great tutorial on how to get started with the Adobe Analytics Real-Time API that you need to check out. The example was used in a lab session at past Adobe Summits and it looks like it was offered again at the 2016 Adobe Summit. If you went to Summit let me know how the session was. I haven’t attended the session before, but I was in search of a real-time API sample for Adobe Analytics and I stumbled upon this gem.

In this post I am going to walk you through Lesson 1 and Lesson 6 from this tutorial. Lesson 1 gives you the basic fundamentals needed to run a Adobe Analytics real-time report. Lesson 6 gives you a working real-time dashboard with snazzy D3.js visualizations that you can load right now in your browser. Hopefully you can use this as the foundation for building some actionable solutions that leverage real-time data at your organization. I look forward to hearing about the real-time dashboard you build or the real-time content and campaign optimization or the real-time site health alert tools. Please share what you create in the comments or @ryanpraski.

Continue Reading

How to Add 100 Users to Adobe Analytics in Seconds

Adobe_Analytics_API_Add_Multiple_Users

Website to add multiple users
Sample CSV file to upload to the website

The Problem: How to add 100 users to Adobe Analytics as efficiently as possible?

A client recently requested that I add 100 new users to an Adobe Analytics account. I didn’t want to go in and add each user one by one via user management in the administrative console. It could take an hour or more to fill in the required fields for each of the 100 users. Administrative upkeep and user management is tedious work that is prone to errors. There had to be a better way.

The Solution: Use a web application that leverages the Adobe Analytics API

Continue Reading

Format Percent Change Red & Green- Excel & Google Sheets for Digital Analytics: Tips & Tricks

google_sheet_percentage_change
If an increase is good and a decrease is bad format percent change like this
[Green]▲ 0.00%;[Red]▼ -0.00%

If an increase is bad and a decrease is good format percent change like this
[Red]▲ 0.00%;[Green]▼ -0.00%

Download Excel Sample

Google Sheet Sample

You are putting together a report or dashboard and you want to make it simple to understand changes in metrics. By adding color and arrows to a percent change you can help better visualize the meaning of the data. This post shows you how to add green and red color and up and down arrows to highlight changes in metrics in Excel and Google Sheets.

Continue Reading

Format Time on Page- Excel & Google Sheets for Digital Analytics: Tips & Tricks

• Download Excel Sample
• Google Sheet Sample

4.33 -> 04:20 Adobe Analytics
179.04 -> 02:59 Google Analytics

When you pull metrics like average time on page from digital analytics tools the number format looks like this: 4.33

I remember scratching my head the first time I saw this in Adobe Analytics (then Omniture). Was the other dot in the colon missing and did this mean 4:33 or 4 minutes 33 seconds? Or did this actually mean 4 minutes 0.33 * 60 seconds (0.33 multiplied by 60) which equals 4 minutes 19.8 seconds?

average_time_on_page_adobe_analytics

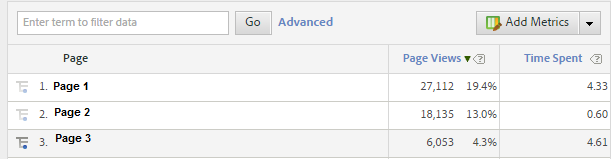
Average Time on Page in Adobe Analytics Report & Analytics

Drum roll please… it means 4 minutes 0.33 * 60 seconds or 04:20. For those of you who were able to convert 4.33 from an a number with a decimal to time in your head please pat yourself on the back and let me know in the comments. For the rest of us, this post will show how to convert a number with decimal time to minutes and seconds time formatting using Excel and Google Sheets.

Continue Reading

Using the Adobe Analytics API for Report Suite Configuration

adobe_analytics_api_explorer

Last updated on August 9, 2018

In July 2018 Adobe took down the Developer Connection site tools and content that included the Adobe Analytics API Query Explorer, code samples, documentation and the developer forum. All of the Adobe Analytics API tools, documentation and samples have been moved to GitHub. To replace the Adobe API Query Explorer use Postman and the Adobe Analytics API Postman guide. If you have questions about the Postman setup let me know. Once you are setup you can follow the rest of this tutorial and use Postman instead of the Adobe API Query Explorer.

This post describes an actual situation I found myself in when setting up a new report suite in Adobe Analytics. In options 1-3 I go over standard administrative console based options for copying settings between report suites. In option 4 I introduce another option that uses the Adobe Analytics API. I recommend perfecting the Adobe Analytics API report suite configuration and usage on a test report suite first before applying what you’ve learned to a production report suite.

Check out my new post on How to Add 100 Users to Adobe Analytics in Seconds for information on how to use a web application that leverages the Adobe Analytics API to add multiple users fast.

Continue Reading