From Web Analytics to Scheduling Meetings?

Digital Analytics Association NYC Symposium 2015

daa_syposium_nyc
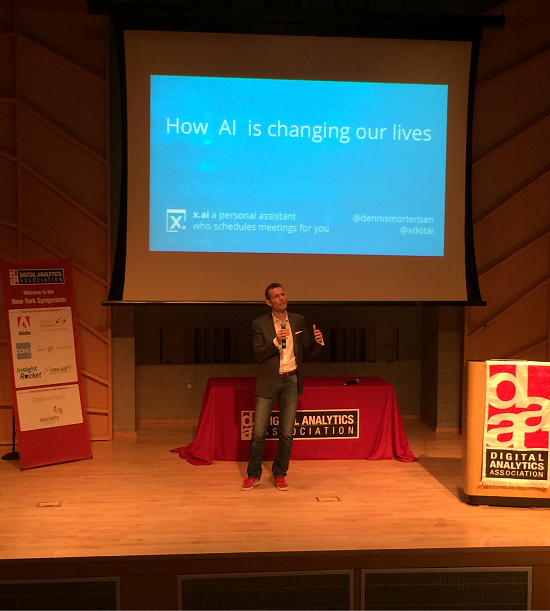
Last week I attended my first Digital Analytics Association (DAA) Symposium in New York City. The theme of the Symposium was “Beyond Measure” how we’re using our own and others’ data in ever-more imaginative ways to create new products, experiences and possibilities for consumers and businesses. This theme really resonated with me. In our day to day work as digital analysts we are often very heads down. We focus on implementing, reporting and analyzing digital data, but less time thinking about bigger picture uses of data. The keynote by Dennis Mortensen of x.ai a personal assistant that let’s you schedule meetings via email using artificial intelligence was inspiring. This post will tell Dennis’ story about going from founding two digital analytics companies to founding a company that schedules meetings.

Continue Reading

Format Time on Page- Excel & Google Sheets for Digital Analytics: Tips & Tricks

• Download Excel Sample
• Google Sheet Sample

4.33 -> 04:20 Adobe Analytics
179.04 -> 02:59 Google Analytics

When you pull metrics like average time on page from digital analytics tools the number format looks like this: 4.33

I remember scratching my head the first time I saw this in Adobe Analytics (then Omniture). Was the other dot in the colon missing and did this mean 4:33 or 4 minutes 33 seconds? Or did this actually mean 4 minutes 0.33 * 60 seconds (0.33 multiplied by 60) which equals 4 minutes 19.8 seconds?

average_time_on_page_adobe_analytics

Average Time on Page in Adobe Analytics Report & Analytics

Drum roll please… it means 4 minutes 0.33 * 60 seconds or 04:20. For those of you who were able to convert 4.33 from an a number with a decimal to time in your head please pat yourself on the back and let me know in the comments. For the rest of us, this post will show how to convert a number with decimal time to minutes and seconds time formatting using Excel and Google Sheets.

Continue Reading

Using the Adobe Analytics API for Report Suite Configuration

adobe_analytics_api_explorer

Last updated on August 9, 2018

In July 2018 Adobe took down the Developer Connection site tools and content that included the Adobe Analytics API Query Explorer, code samples, documentation and the developer forum. All of the Adobe Analytics API tools, documentation and samples have been moved to GitHub. To replace the Adobe API Query Explorer use Postman and the Adobe Analytics API Postman guide. If you have questions about the Postman setup let me know. Once you are setup you can follow the rest of this tutorial and use Postman instead of the Adobe API Query Explorer.

This post describes an actual situation I found myself in when setting up a new report suite in Adobe Analytics. In options 1-3 I go over standard administrative console based options for copying settings between report suites. In option 4 I introduce another option that uses the Adobe Analytics API. I recommend perfecting the Adobe Analytics API report suite configuration and usage on a test report suite first before applying what you’ve learned to a production report suite.

Check out my new post on How to Add 100 Users to Adobe Analytics in Seconds for information on how to use a web application that leverages the Adobe Analytics API to add multiple users fast.

Continue Reading

Top 3 Takeaways From The X Change 2014 Conference

xchange_phoenician_hotel

X Change 2014 Phoenician Resort Scottsdale, AZ


The X Change digital analytics conference is always a highlight of the year. In its 8th edition, the conference gathered a group of the top enterprise analytics practitioners from companies like Nike, Vanguard, Facebook and Adobe at the Phoenician Resort in Scottsdale, Arizona. What continues to set X Change apart from other conferences is the intimate interactive huddle format. Between 10 and 20 attendees huddle up (football pads optional) on topics like: “Taking all the Credit: The Promise of Marketing Attribution Technology” and “Data Integration: The Good The Bad and The Ugly”. You can see a full list of the huddles here. A huddle leader is assigned to each group discussion, but that person’s role is to facilitate and guide the discussion, rather than speak at the participants. What follows is an honest discussion about what has worked as well as challenges and questions different organizations are facing. I’ve been lucky enough to attend X Change the last 6 years as a member of Semphonic and now the EY team and I want to share my top 3 takeaways from the X Change 2014 conference with a bonus takeaway at the end of the post.

Continue Reading