Integrate Google Adwords & Google Analytics with Salesforce Guide

salesforce_google_analytics_integration__ga_visitor_id_in_sf_lead_detail

How do you integrate Google Adwords and Salesforce?
How do you integrate Google Analytics and Salesforce?

The simple answer to any data integration question: you need a unique identifier that is shared across both systems. This post will give you detailed step by step instructions on how to set and capture the unique identifier to integrate Salesforce with Google Adwords and Google Analytics.

Continue Reading

Google Search Console API R: Guide to get Started

google_search_console_api_r_amazing

This tutorial shows you how to setup a daily automated pull of Google Search Console data (formerly known as Google Webmaster Tools) using R. The example shows you how to save your Organic search data daily to get around Google’s current 90 day limit on historical data. Armed with this historical organic search data you can measure your content marketing and SEO efforts over months and years not just the previous 90 days. Take back your ‘not provided’ organic keyword data.

No previous knowledge of programming, APIs or R is necessary to complete this tutorial. Like my previous tutorial on getting started with the Google Analytics reporting API with Python (please check it out), I want to help you get started with a detailed example that you can use right now.

Continue Reading

Real-Time Reporting Adobe Analytics API Tutorial

adobe_analytics_real-time_dashboard_sample_

Adobe has a nice real-time dashboard built directly into Reports & Analytics (SiteCatalyst). It is easy to configure and get up and running quickly. According to Adobe product manager Ben GainesReal-Time reports in Adobe Analytics has become one of the most popular features in Reports & Analytics.” What you may not know is that real-time data can be accessed via Adobe’s reporting API. Adobe has a great tutorial on how to get started with the Adobe Analytics Real-Time API that you need to check out. The example was used in a lab session at past Adobe Summits and it looks like it was offered again at the 2016 Adobe Summit. If you went to Summit let me know how the session was. I haven’t attended the session before, but I was in search of a real-time API sample for Adobe Analytics and I stumbled upon this gem.

In this post I am going to walk you through Lesson 1 and Lesson 6 from this tutorial. Lesson 1 gives you the basic fundamentals needed to run a Adobe Analytics real-time report. Lesson 6 gives you a working real-time dashboard with snazzy D3.js visualizations that you can load right now in your browser. Hopefully you can use this as the foundation for building some actionable solutions that leverage real-time data at your organization. I look forward to hearing about the real-time dashboard you build or the real-time content and campaign optimization or the real-time site health alert tools. Please share what you create in the comments or @ryanpraski.

Continue Reading

Google Sheets Remove Empty Columns & Rows Automatically

google_sheets_remove_empty_columns_remove_empty_rows

This is a tutorial on how to remove empty columns and rows in Google Sheets automatically with the click of a button. If you work with lots of data in Google Docs, this will help you stay under the 2 million cell limit in Google Sheets by removing unused cells. Here is the sample sheet. Go to the File – Make a Copy to edit the sheet.

Continue Reading

Python Google Analytics API Over 1 mil Rows Unsampled Data + Pull Data From Multiple Profiles

How to pull large data sets with over 1 million rows from Google Analytics and avoid sampling?
How to pull the same data across multiple Google Analytics profiles?

google_analytics_python_api_1_million_rows
This post provides a solution for exporting more than 10,000 rows (the example pulls over 1 millions rows) and a solution for the sampling limitations of Google Analytics. The solution uses the Google Analytics reporting API and Python. It checks for the presence of sampling before running a query and gives you the ability to break your query down into smaller 10,000 row pieces. The pieces are multiple smaller queries with shorter date ranges. All the data from the small queries are stitched together and output into a single CSV file for the full date range. With this solution you can also pull data from multiple profiles using this single Python application. If you work across multiple Google Analytics profiles with high traffic volumes and often run into sampling, then this solution should save you lots of time. If you’d like to see how to use the Google Analytics Sheets Add-on to pull more than 10k rows of data and avoid sampling check out my previous post.

Continue Reading

Pull More than 10k rows Unsampled using Google Analytics Sheets Add-on

How to pull a Google Analytics report with more than 10,000 rows?
How to get around Google Analytics Sampling Limitations?

Sample Google Analytics Sheet used in this tutorial (file make a copy to edit)

google_analytics_google_sheet_add-on

Google Analytics Sheet Add-on 119,421 rows of data

How do you pull a Google Analytics report with more than 10,000 rows? How do you get around Google Analytics Sampling Limitations? These were the most common questions I was asked after my recent Google Analytics reporting API Python tutorial. This new tutorial will show you how to export more than 10,000 rows using the Google Analytics Spreadsheet Add-on and how avoid the sampling limitations of Google Analytics. I also have another post in the works on how to use Python and the Google Analytics API to avoid sampling and pull even more data. Keep an eye out for the new post!

Continue Reading

Google Analytics Reporting API Python Tutorial

• Download Python 2
Register your application for the Analytics API in Google Developers Console 
Download the Google Python API Sample Code
Google Analytics Query Explorer
Python Code to Output Google Analytics API Query Data to CSV *save file as .py

Check out this new post on how to pull over 1 million rows of unsampled data using Python & how to pull data from multiple profiles

Check out this new post on how to pull more than 10000 rows of unsampled data using the Google Analytics Sheets Add-on.

R users check out this tutorial on how to pull your first Google Analytics R v4 reporting API query.

This guide will go through step by step instructions on how to setup Python and pull your first query directly from the Google Analytics reporting API. I will show you how to install Python on Windows and add the Google API Python library. We will create a new project in the Google Developers Console and enable the Analytics API. Next we will use a prebuilt sample Python application to get data out of Google Analytics via the API. Then I’ll walk you through how to test your own query using the Google Analytics Query Explorer. Then we will edit the Python application code to create your very own query. And finally we will pull Google Analytics data directly into Excel using Python to write a CSV file containing the Google Analytics data.

Continue Reading

How to Add 100 Users to Adobe Analytics in Seconds

Adobe_Analytics_API_Add_Multiple_Users

Website to add multiple users
Sample CSV file to upload to the website

The Problem: How to add 100 users to Adobe Analytics as efficiently as possible?

A client recently requested that I add 100 new users to an Adobe Analytics account. I didn’t want to go in and add each user one by one via user management in the administrative console. It could take an hour or more to fill in the required fields for each of the 100 users. Administrative upkeep and user management is tedious work that is prone to errors. There had to be a better way.

The Solution: Use a web application that leverages the Adobe Analytics API

Continue Reading

How I found my Career in Digital Analytics on Craigslist 7 Years Ago

semphonic_staff_xchange_2010_monterey_ca

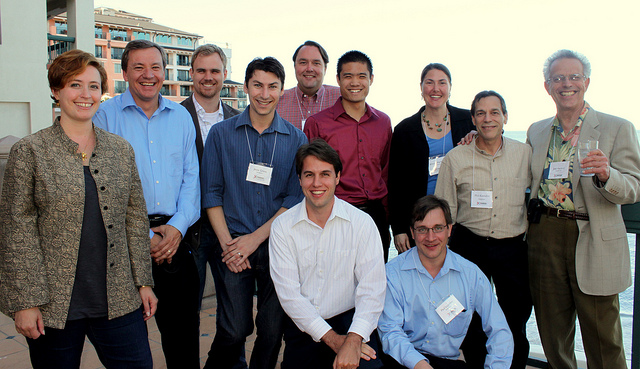
Semphonic Staff at XChange 2010 Monterey California

Digital Analytics is an amazing field. I am so lucky to have found something so interesting so early in my career. Like most web analytics professionals I didn’t plan on being a web analyst. In fact before I started searching for a new job in spring of 2008 I had never heard of web analytics. In my 7 year web analytics career I’ve been fortunate to work for Semphonic and for the last 2 years plus Ernst & Young following the acquisition of Semphonic in March 2013. Thankfully Gary Angel and Joel Hadary hired me in July 2008. I’ve been lucky to have Paul Legutko as my mentor, manager and my professor of digital analytics for the entire 7 years. When people ask me about Paul I describe him as the professor that you wished you had in college: smart, patient, funny, willing to take the time to answer your questions and truly an amazing teacher. (Before web analytics Paul spent time teaching and doing post-doctoral research at the University of Michigan and Stanford University). I can’t believe it has been 7 years. Before too much more time passed I wanted to make sure to recount how I got into digital analytics. I responded to Semphonic’s Craiglist job post and the rest is history. Here is the story.

Continue Reading

Format Percent Change Red & Green- Excel & Google Sheets for Digital Analytics: Tips & Tricks

google_sheet_percentage_change
If an increase is good and a decrease is bad format percent change like this
[Green]▲ 0.00%;[Red]▼ -0.00%

If an increase is bad and a decrease is good format percent change like this
[Red]▲ 0.00%;[Green]▼ -0.00%

Download Excel Sample

Google Sheet Sample

You are putting together a report or dashboard and you want to make it simple to understand changes in metrics. By adding color and arrows to a percent change you can help better visualize the meaning of the data. This post shows you how to add green and red color and up and down arrows to highlight changes in metrics in Excel and Google Sheets.

Continue Reading